ARMCO’s Mortgage QC Industry Trends Report represents an analysis of nationwide quality control findings based on data derived from the ACES Analytics benchmarking software.
Executive Summary
QC Industry Trends – Overview
QC Industry Trends – by Category
QC Industry Trends – by Loan Purpose
QC Industry Trends – by Loan Type
Conclusion
About this Report
Executive Summary
This report utilizes information derived from loan files analyzed by the ACES Analytics benchmarking system to provide defect-related mortgage quality control data for Q4 2016 and the entire 2016 calendar year.
The ACES Analytics benchmarking dataset includes post-closing quality control data from over 65 lenders, comprising more than 75,000 unique loans selected for random full-file reviews. Defects are categorized using the Fannie Mae loan defect taxonomy. Data for any given calendar quarter is analyzed approximately 90 days after the end of the quarter, to allow for sufficient elapsed time for the post-closing quality control cycle to be completed. As a result, data for the calendar year 2016 is published by ARMCO in Q2 2017.
ARMCO’s analysis shows that Legal/Regulatory/Compliance and Loan Package Documentation were the leading defect categories in 2016. TRID’s implementation in late 2015 brought an increase in the number of Legal/Regulatory/Compliance defects as compared to prior years. During this period, Loan Package Documentation defects remained steady.
Report highlights include:
- The benchmark Critical Defect Rate increased slightly to 1.50% in Q4 2016 from the previous quarter
- TRID and Loan Package Documentation accounted for over 68% of all reported defects in 2016
- Q4 2016 purchase transactions accounted for more than 51% of the benchmark data—a predictive indicator for the threat of increased risk in 2017
QC Industry Trends – Overview
Figure 1 displays the overall percentage of loans with critical defects (the “Critical Defect Rate”) as a percentage of total closed loans for the past four calendar quarters.
The Critical Defect Rate increased slightly in Q4 to 1.50%, an 18% increase from the 2016 low of 1.27% in Q3. A key driver of the increase was a shift to purchase transactions in Q4 2016. In Q3 2016, purchase transactions accounted for just under 48% of our benchmark data but by the end of Q4, they accounted for more than 51%. This change in the overall make-up of loan production is a predictive indicator of possible changes in 2017. Barring other changes that lower the Critical Defect Rate, we are likely to see increased defects associated with a purchase driven market.
Additional industry data closer to the mortgage funding side suggests that purchase-related defects have already increased. According to a December 2016 report published by First American Financial Corporation, application loan defects “moved modestly higher on increases in risk for purchase and refinance applications, in combination with the continuing shift toward a purchase-dominated market”1. This is consistent with trends on the post-closing quality control side. While loan application defects do not necessarily result in Critical Loan Defects post-closing, an increase in the trend rate on the origination side tends to correlate with findings in post-closing quality control.
Critical Defect Rate, Q1 2016 – Q4 2016
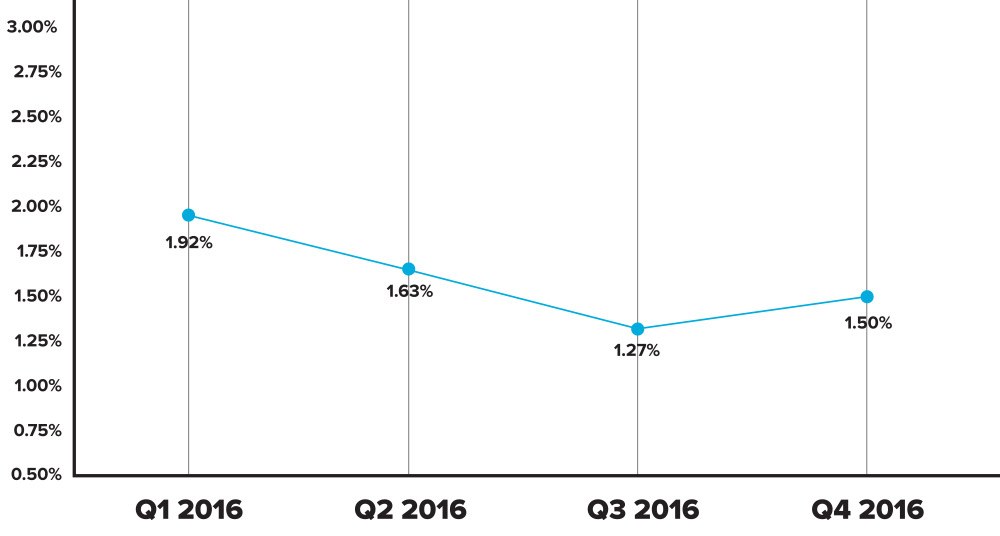
Figure 1: Percentage of all critical defects by quarter
1 http://www.firstam.com/economi...
QC Industry Trends – By Category
Figure 2 shows a breakdown of all reported net defects (critical and non-critical) in accordance with Fannie Mae defect categories.
Legal/Regulatory/Compliance and Loan Package Documentation continue to be the top two defect categories among all loan defects reported. Loan Package Documentation, which has long been one of the top defect categories, continues to be a recurring problem for the lending community. In most cases, while defects related to Loan Package Documentation rarely result in actual non-saleable loans, the ability to cure these defects with little to no financial impact continues to hinder the needed corrective action to significantly reduce these defects. The same cannot be said about the defects associated with Legal/Regulatory/Compliance.
In 2016, the entire lending industry was impacted by the enhanced regulatory oversight from the Consumer Finance Protection Bureau (CFPB) as the long-awaited implementation of TRID was fully realized. Many lenders spent the better part of Q1 addressing the multitude of mistakes associated with TRID. In some cases, this resulted in originating loans that were not salable on the secondary market.
A wave of corrective action followed, and soon the sheer amount of resources directed at solving these issues became overwhelming for many lenders. In closing out 2016, Legal/Regulatory/Compliance defects still hold the lead of all defect categories. However, the number of critical defects associated with TRID have dropped significantly. The top three TRID-related defects for 2016, as reported in conjunction with post-closing quality control reviews, are:
- Final Loan Estimate and/or Closing Disclosure not in file for review
- Timing of borrower receipt of Closing Disclosure
- Fee tolerance violation with invalid Change of Circumstance
Defect Rates by Fannie Mae Category, 2016
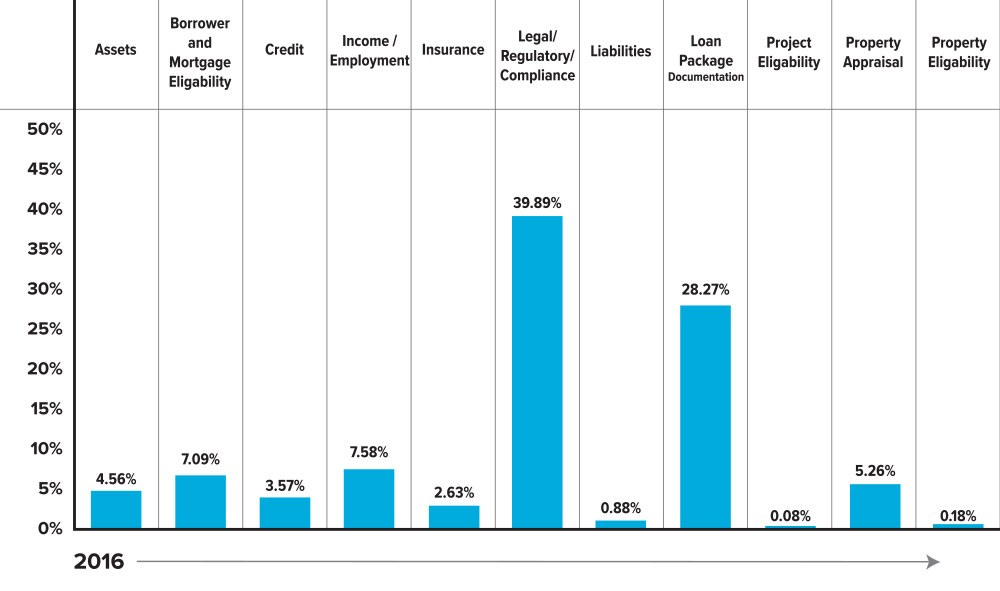
Figure 2: Breakdown of net defects (all severities) by Fannie Mae categories for 2016.
QC Industry Trends – Credit Focus
QC Industry Trends — Top Credit Related Critical Defects
Figure 3 provides a breakdown of all “credit” related defects broken down by Fannie Mae Defect Category.
Loan Package Documentation continued to be a key contributor to credit-related defects, accounting for 47% of all credit-related defects reported, while Income/Employment and Borrower/Mortgage Eligibility accounted for nearly 25%.
Credit Only – Defect Rates by Fannie Mae Category, 2016
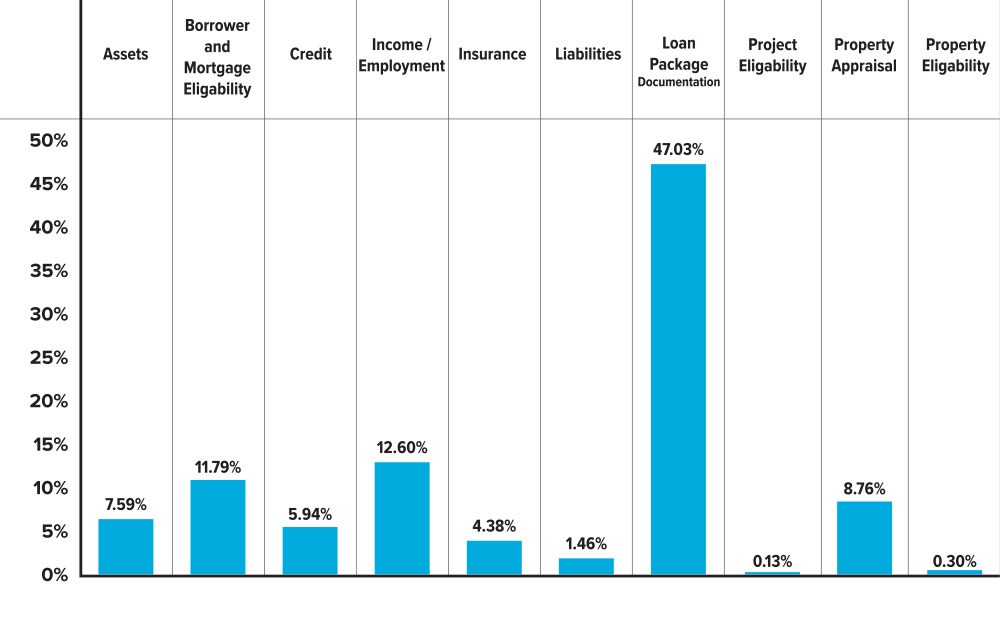
Figure 3: Breakdown of "Credit" defects by Fannie Mae categories for 2016
Income/Employment, as a Percentage of All Credit Defects, 2016
Figure 4 breaks down all 2016 defects for Income/Employment into sub-categories.
Income documentation defects account for 60.75% of all Income/Employment defects. The most common defect was failure to obtain a VVOE (verbal verification of employment) within 10 days of closing.
Income/Employment 2016
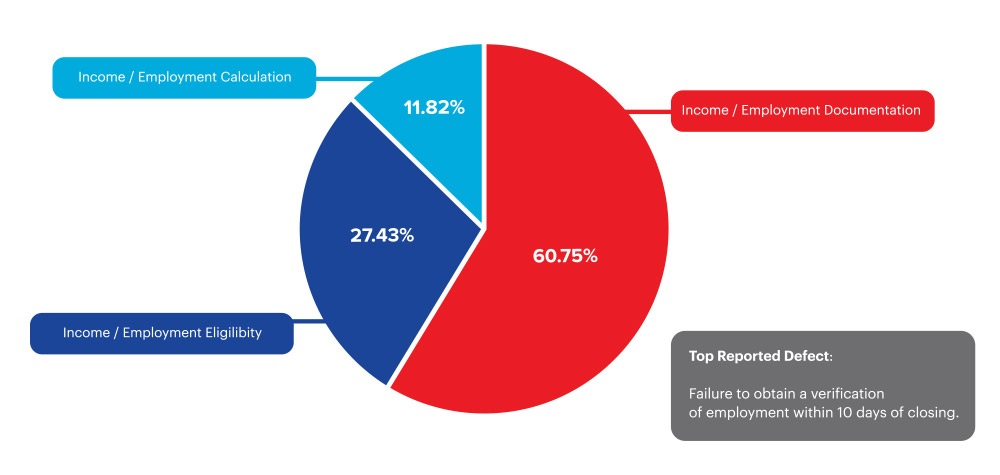
Figure 4: Income/Employment sub-categories 2016.
Borrower/Mortgage Eligibility, as a Percentage of All Credit Defects, 2016
Figure 5 shows a breakdown of all 2016 defects for Borrower/Mortgage Eligibility broken down by sub-categories.
Mortgage/Program Eligibility defects account for 77.61% of all Borrower/Mortgage Eligibility defects. The most common defects were eligibility issues relating to the increase in alternative product offerings (i.e. annual household income requirements associated with bond and or down payment assistance programs).
Borrower and Mortgage Eligibility 2016
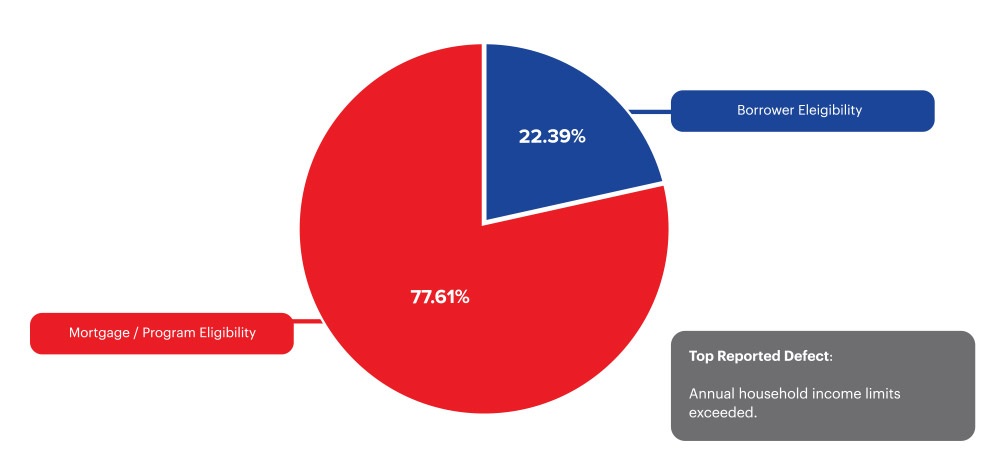
Figure 5: Borrower/Mortgage Eligibility sub-categories 2016.
Conclusion
TRID had a heavy impact on loan defects in 2016. Although TRID was officially implemented on October 3, 2015, its effects took hold in the post origination world in early 2016. As lenders, investors, insurers, and warehouse lenders focused TRID-related efforts primarily on protecting themselves against potentially non-salable loans, post-closing quality control teams at lenders worked feverishly to identify all TRID defects and initiate the appropriate corrective action throughout the manufacturing process.
Much of lenders’ Q1 2016 efforts were driven by trial-by-fire efforts. As such, changes in their processes, people and systems were almost a daily event, which led to a spike in the industry’s critical defect rate. As the year progressed, the industry gained a better understanding of TRID’s impact, which TRID defects were severe enough to make a loan non-salable, and which were relatively minor and curable . This led many lenders to reclassify TRID defects from critical severity to non-critical severity categories. As a result, the industry’s overall Critical Defect Rate trended downward in Q1 through Q3 2016. In Q4 2016, there was a slight uptick driven by a shift to the purchase market.
About the ARMCO Mortgage QC Industry Trends Report
The ARMCO Mortgage QC Industry Trends Report represents a nationwide post-closing quality control analysis using data and findings derived from mortgage lenders utilizing the ACES Analytics benchmarking software. This report provides an in-depth analysis of residential mortgage defects as reported during post-closing quality control audits. Data presented comprises net defects and is categorized in accordance with the Fannie Mae loan defect taxonomy.
About ARMCO
ARMCO – ACES Risk Management delivers web-based audit technology solutions, as well as powerful data and analytics, to the nation’s top mortgage lenders, servicers, investors and outsourcing professionals. A trusted partner devoted to client relationships, ARMCO offers best-in-class quality control and compliance software that provides U.S. banks, mortgage companies and service providers the technology and data needed to support loan integrity, meet regulatory requirements, reduce risk and drive positive business decisions. ARMCO’s flagship product, ACES Flexible Audit Technology®, is available at any point in the mortgage loan lifecycle, to any size lender, and is user-definable. ACES standardizes audit requirements, ties pre-funding reviews to post-closing quality control audits, enables seamless trend analysis, identifies credit, compliance and process deficiencies and helps create manageable action plans. For more information, visit www.acesquality.com or call 1-800-858-1598.
MEDIA CONTACT:
Jeri Yoshida
Yosh Communications
jeri@yoshcomm.com
310 651 0057